Geophysical Subsurface Modelling and Imaging
Computational-based studies undertaken to address challenges and advances in the acquisition, processing, interpretation and visualisation of subsurface geophysical data. The geophysical data comprises field survey and synthetic data as appropriate. Optimal geophysical approaches applicable to prevailing geological environments are investigated through 2D and 3D forward and inverse modelling, imaging studies, geodynamic and Monte Carlo simulations. This work forms part of the research undertaken by the Curtin Discipline of Exploration Geophysics (DEG) for Industry, State Government and Commonwealth funded research projects, e.g. DET CRC, MinEx, MRIWA, WA Department of Water, Water Corporation, CSIRO, CRGC, SW Hub Harvey MT project and NGL. Four main research areas were addressed during the reporting period: DAS, MT Inversion, CO2 Sequestration and Geodynamic modelling. Please note that researchers' permission must be obtained prior to any information or images in this report being used for publication.

Area of science
Geosciences
Systems used
Magnus
Applications used
REDBACK, MOOSE, FFTW, SOFI3D, IFOS2D, LAMMPS, MODEM, Mare2DEM, Airbeo, P223, ANSYS-CFX, SU, BEM++, PythonThe Challenge
DAS:
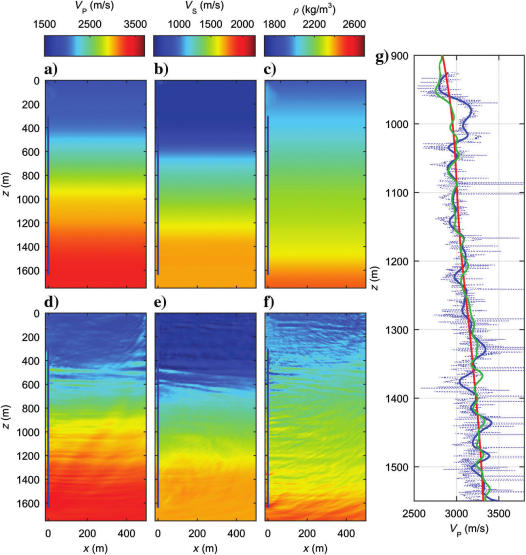
As part of our Pawsey allocation we utilised the facility to perform Full Waveform Inversion (FWI) on Distributed Acoustic Sensors (DAS) within CO2CRC Otway Project. DAS is a rapidly developing technology particularly useful for the acquisition of vertical seismic profile (VSP) surveys. DAS data are increasingly used for seismic imaging, but not for estimating rock properties. We have developed a workflow for estimating elastic properties of the subsurface using FWI of DAS VSP data. Whereas conventional borehole geophones usually measure three components of particle velocity, DAS measures a single quantity, which is an approximation of the strain or strain rate along the fibre. Standard FWI algorithms are developed for particle velocity data, and hence their application to DAS data requires conversion of these data to particle velocity along the fibre.
MT Inversion:
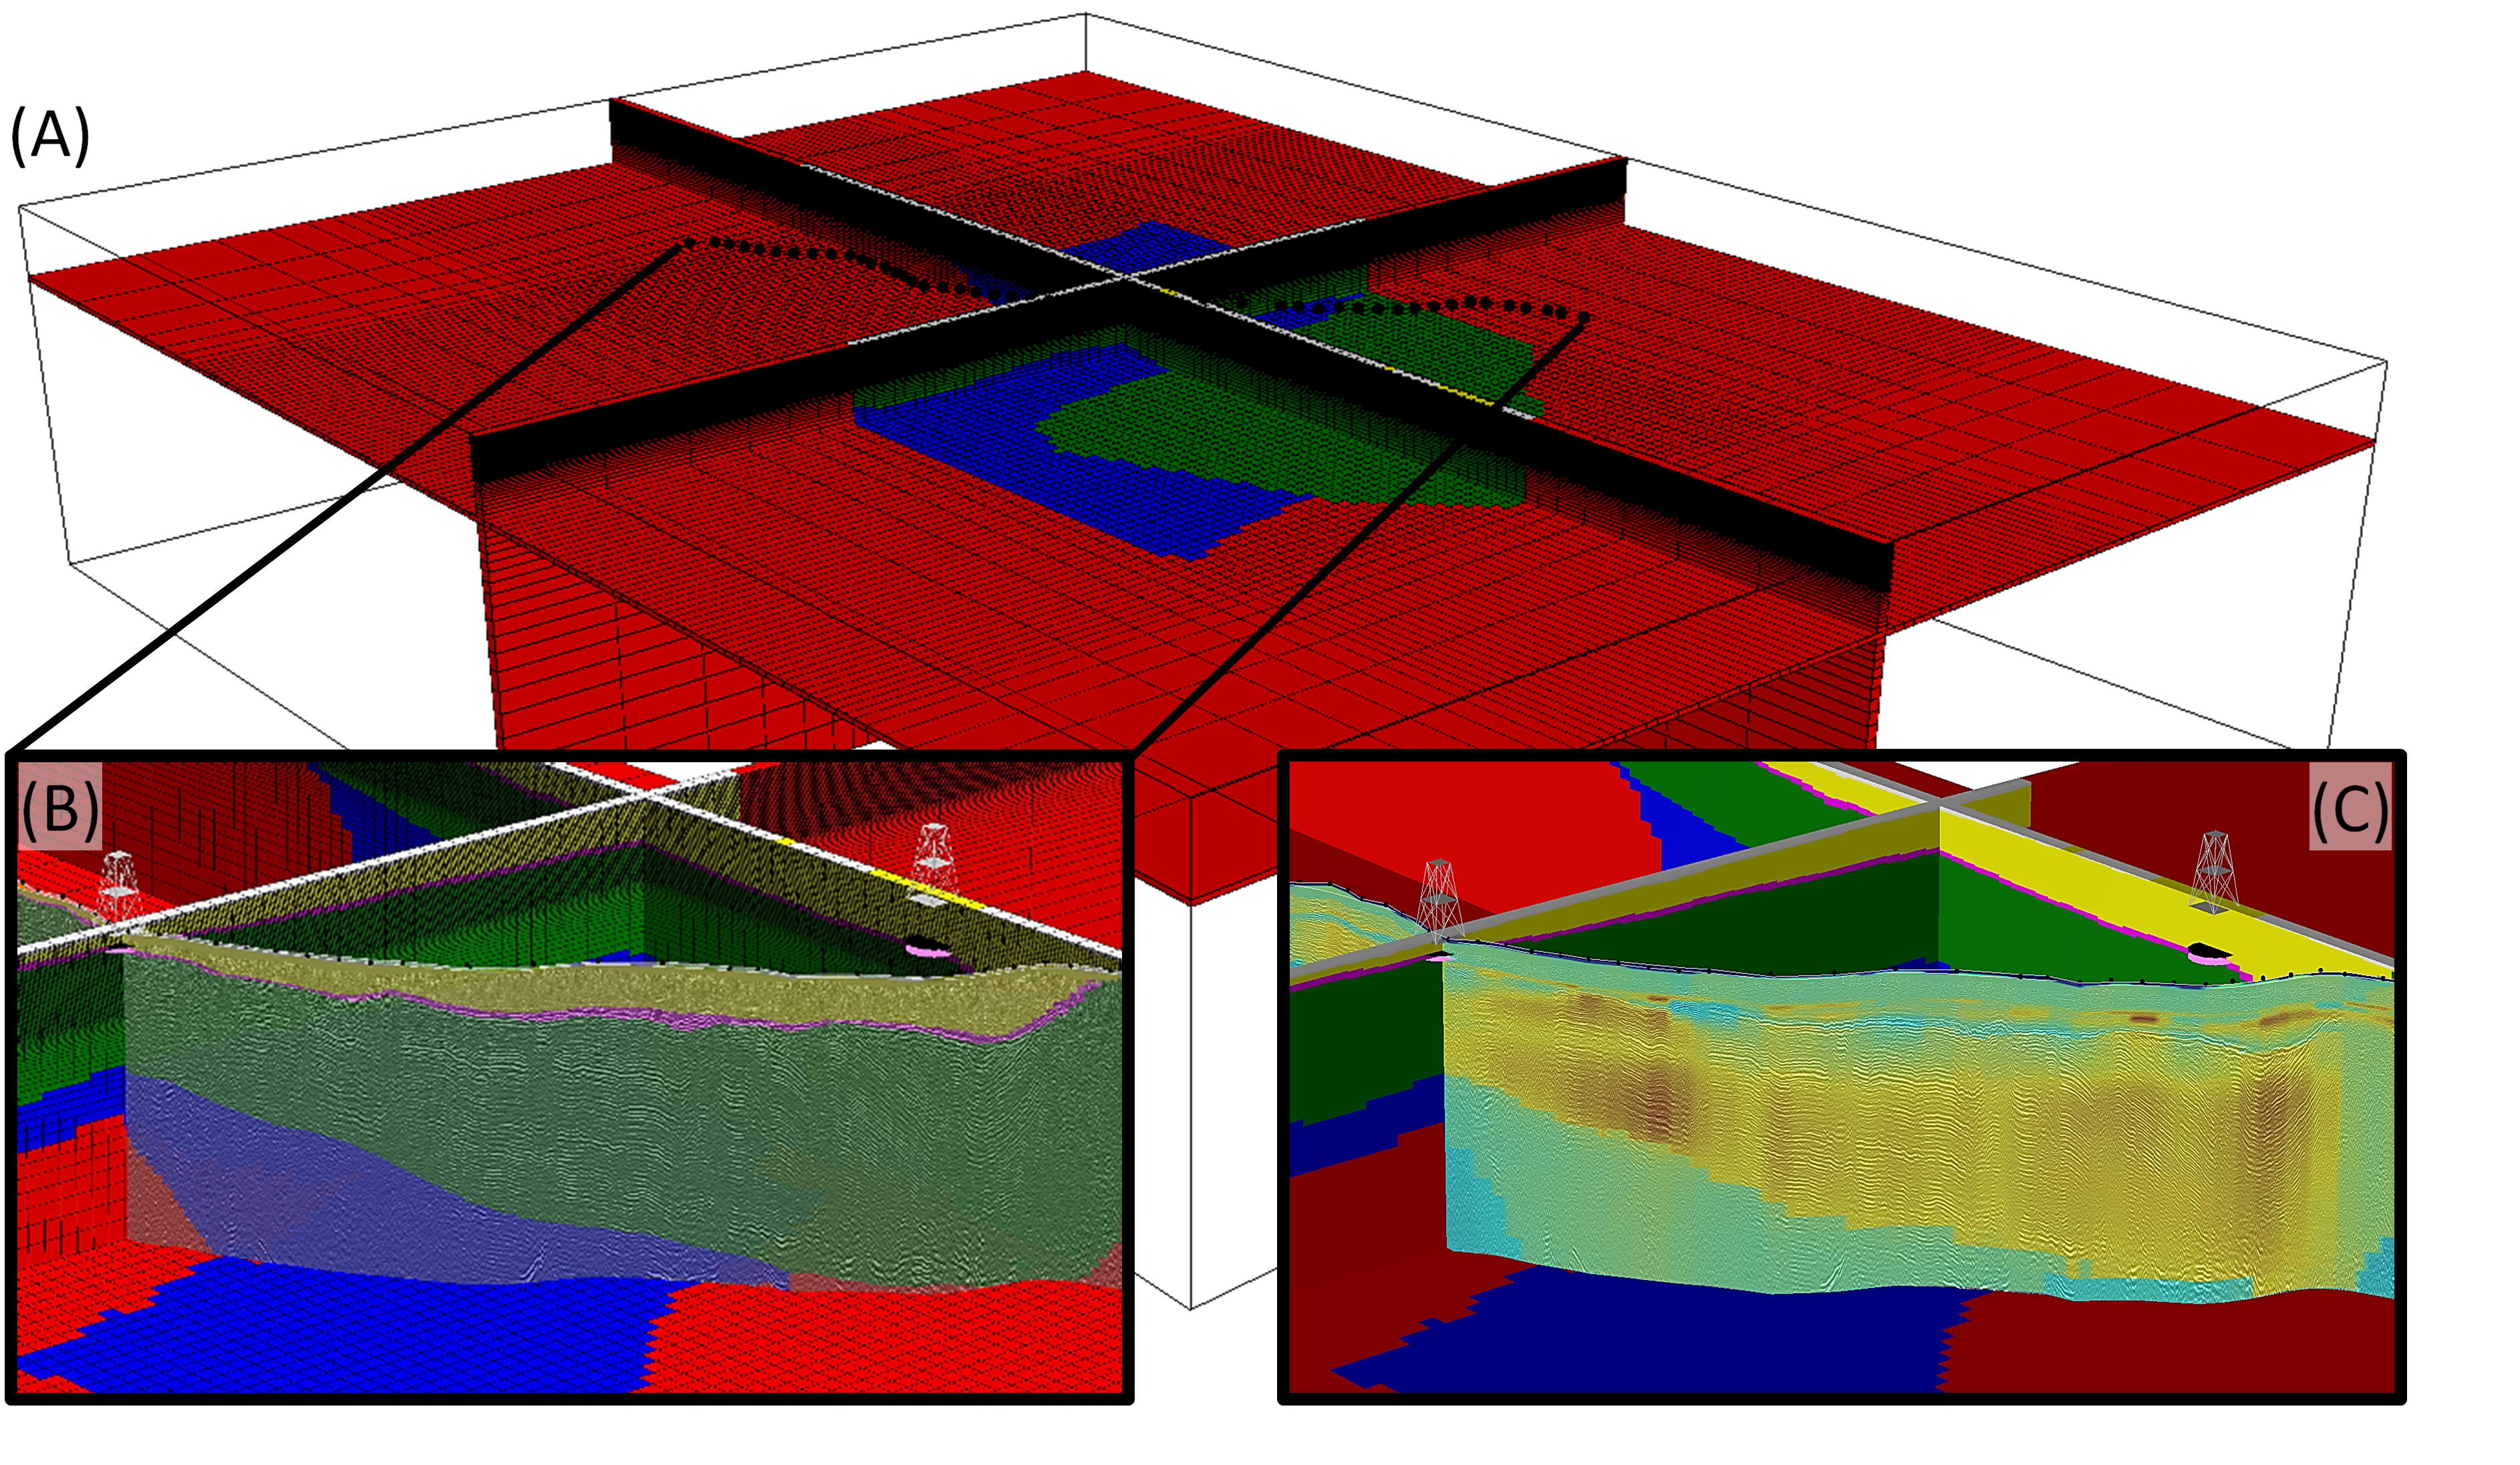
Regional MT data along a ~500 km transect across the Yilgarn-Officer-Musgrave provinces was inverted using a 3D prior resistivity model. The prior model was based on a geological model of the region that for the purpose of inversion was populated with a starting resistivity values. These starting resistivity values themselves were the result of a previous 3D inversion using a simple half-space model, and subsequently averaged for the regions of the geological model.
CO2 Sequestration:
It is very important to further understand the physics behind the multi-phase fluid dynamics regarding the process of CCS (Carbon Capture and Storage). In order to design an effective and safe CCS system at the field scale, knowledge of multiphase flow and trapping mechanisms at the pore scale, are required. This project work will be very useful for measurement and explanation of CO2 saturation, monitoring the CO2 plum size and CO2 plume migration during CO2 injection.
Geodynamic modelling:
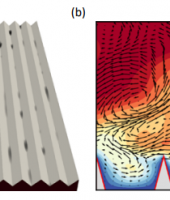
In geothermal reservoirs, geological faults are known to play a major role affecting fluid flow patterns. In previous studies these faults have generally been considered to be static. However, the frictional resistance to motion generates shear heating, and its impact on the temperature-sensitive fluid flow processes has not yet been fully understood.The research undertaken was to investigate the effects of shear heating generated by creeping faults on the onset and pattern of hydrothermal convection.
The Solution
DAS:
The necessary data conversion can be accomplished by a specially designed filter. Field measurements show that the conversion result is close to vertical particle velocity as measured by geophones. Elastic time-domain FWI of a synthetic multioffset VSP data set for a vertical well shows that the inversion of the vertical component alone is sufficient to recover elastic properties of the subsurface. Application of the proposed workflow to a multioffset DAS data set acquired at the CO2CRC Otway Project site in Victoria, Australia, reveals salient subhorizontal layering consistent with the known geology of the site. The inverted compressional velocity model at the well location matches the upscaled velocity log with a correlation coefficient of 0.85.
MT Inversion:
With a large number of cells of 1,981,980 (105X × 132Y × 143Z), and with the aim of trialling different inversion styles, the inversion could only be practically facilitated on a high-performance parallel compute cluster such as Pawsey’s Magnus system.
CO2 Sequestration:
Run simulations of drainage and imbibition processes during CO2 injection with the Pawsey resources (supercomputer) in order to reduce the simulation time. For the pilot study, the problem was solved partly. However, for real conditions (according to the project goals), there was no observed success.
Geodynamic modelling:
The necessary studies are achieved by the implementation of a numerical bifurcation analysis tool based on the pseudo-arclength continuation method. The use of this workflow enables quantitative assessment of the conditions required for the onset of convection, and can be extended to determine the critical value governing the stability of any system of interest. It is required to run transient simulations (for 1000’s timesteps) with large degrees of freedom, which requires a significant amount of time and computing power.
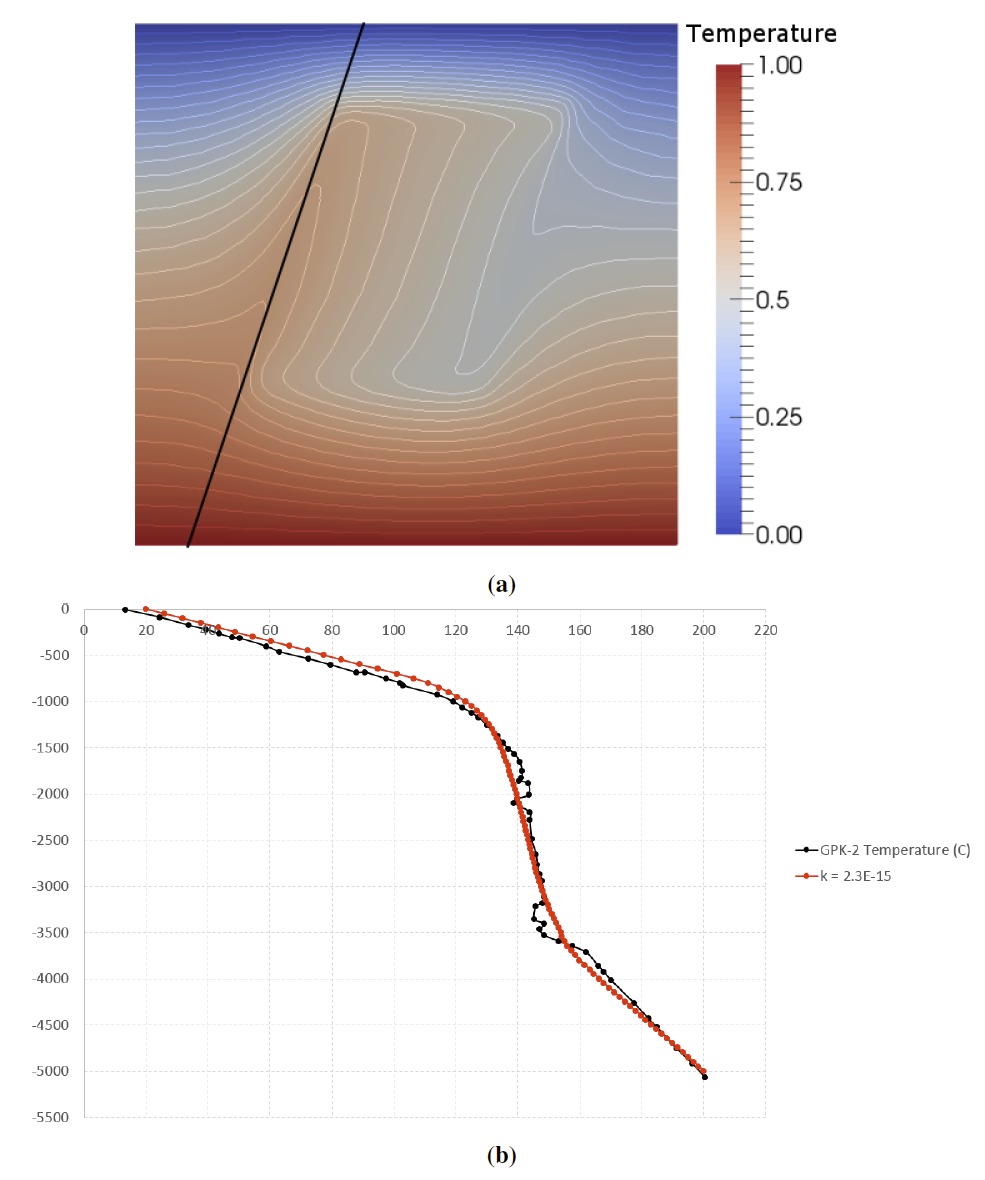
Geodynamic modelling: (a) Steady state simulation result displaying normalised temperature values and isotherms in the entire domain. (b) Temperature values taken along a digitised well bore (black line in (a)) compared to actual well bore.
The Outcome
The computational-based studies undertaken under this project involve large to very large datasets, small timesteps and many repeat runs – which are well suited to a supercomputer.
DAS:
Due to the large computational requirements of FWI algorithms, this work would not be possible without the Pawsey allocation.
MT Inversion:
The resulting inversion models using geological prior models resulted in an improved representation of subsurface resistivity structures. Figure 2: A shows the 3D prior model; 1B shows a sections through the prior model along the MT transect; 1C shows the section through the model after inversion accentuating electrical resistivity heterogeneities near the top and across the transect.
CO2 Sequestration:
At this moment, there have not been any definitive results. It will take further time and effort to get the solution (run those simulations properly within the Pawsey Centre’s resources).
Geodynamic modelling:
The necessary mathematical formulation to couple mechanical deformation with the classical formulation of hydrothermal convection has been established using the REDBACK geomechanics code, which it has been possible to run on Magnus. Running transient simulations on Magnus enabled simulations to be run with large meshes (100,000’s elements).
Please note that researchers’ permission must be obtained prior to any information or images in this report being used for
publication
List of Publications
DAS:
Egorov, A., J. Correa, A. Bóna, R. Pevzner, K. Tertyshnikov, S. Glubokovskikh, V. Puzyrev, and B. Gurevich, 2018, Elastic full-waveform inversion of vertical seismic profile data acquired with distributed acoustic sensors, Geophysics, Vol. 83, No. 3 (May-June 2018); p. R273–R281. doi: 10.1190/GEO2017-0718.1
MT Inversion:
Papers on this research will be published in 2019.
CO2 Sequestration:
Publication will be in form of future PhD Thesis.
Geodynamic modelling:
PhD Thesis currently under examination.